Worker Sentiment Recovered in Q3
However, Weak Spots Remain
The Q3 2026 Employee Mindset Score is 67.3, up 1.3 points from Q2. Market confidence drove the rebound.
The Employee Mindset Score
The Employee Mindset Score combines job satisfaction, employee confidence, and AI threat perception into one number that captures how American workers feel. At 67.3, the EMS recovered most of the ground it lost in the spring. Q2’s 1.8-point drop was real. So was the bounce back, and Q3 now sits statistically even with Q1’s 67.8.
The recovery came from sentiment, mostly from how workers perceive the current job market. The harder measures moved less. 48% of workers still could not cover 4 months of expenses without a paycheck. Entry-level workers still score 12 points lower than executives on overall mindset. And workers in an arrangement they did not choose, like being in the office full time when they want remote, remain the least satisfied group.
Job Satisfaction Index
▲ 1.2 from Q2
The rebound came almost entirely from pay perception. Workers’ read on whether compensation keeps up with the cost of living recovered sharply, while core satisfaction simply stopped falling.
Employee Confidence Index
▲ 2.0 from Q2
The only statistically confirmed index recovery of the quarter. Confidence increased the most exactly where it declined in Q2: how workers feel about the job market’s next 6 to 12 months.
AI Threat Index
▼ 0.3 from Q2
Flat for the third straight quarter. One exception sits underneath: workers became noticeably more worried in Q2 that AI would hurt their own careers, and that worry has not eased since.
Key Findings
Four headlines from the Q3 2026 American workforce survey
Employee Mindset Score
Worker sentiment is back where it started the year
The EMS fell 1.8 points in Q2, then recovered to 67.3, statistically even with Q1’s 67.8. Satisfaction and confidence followed the same path down and back. After 3 quarters, worker sentiment sits right where the year began.
Job Satisfaction
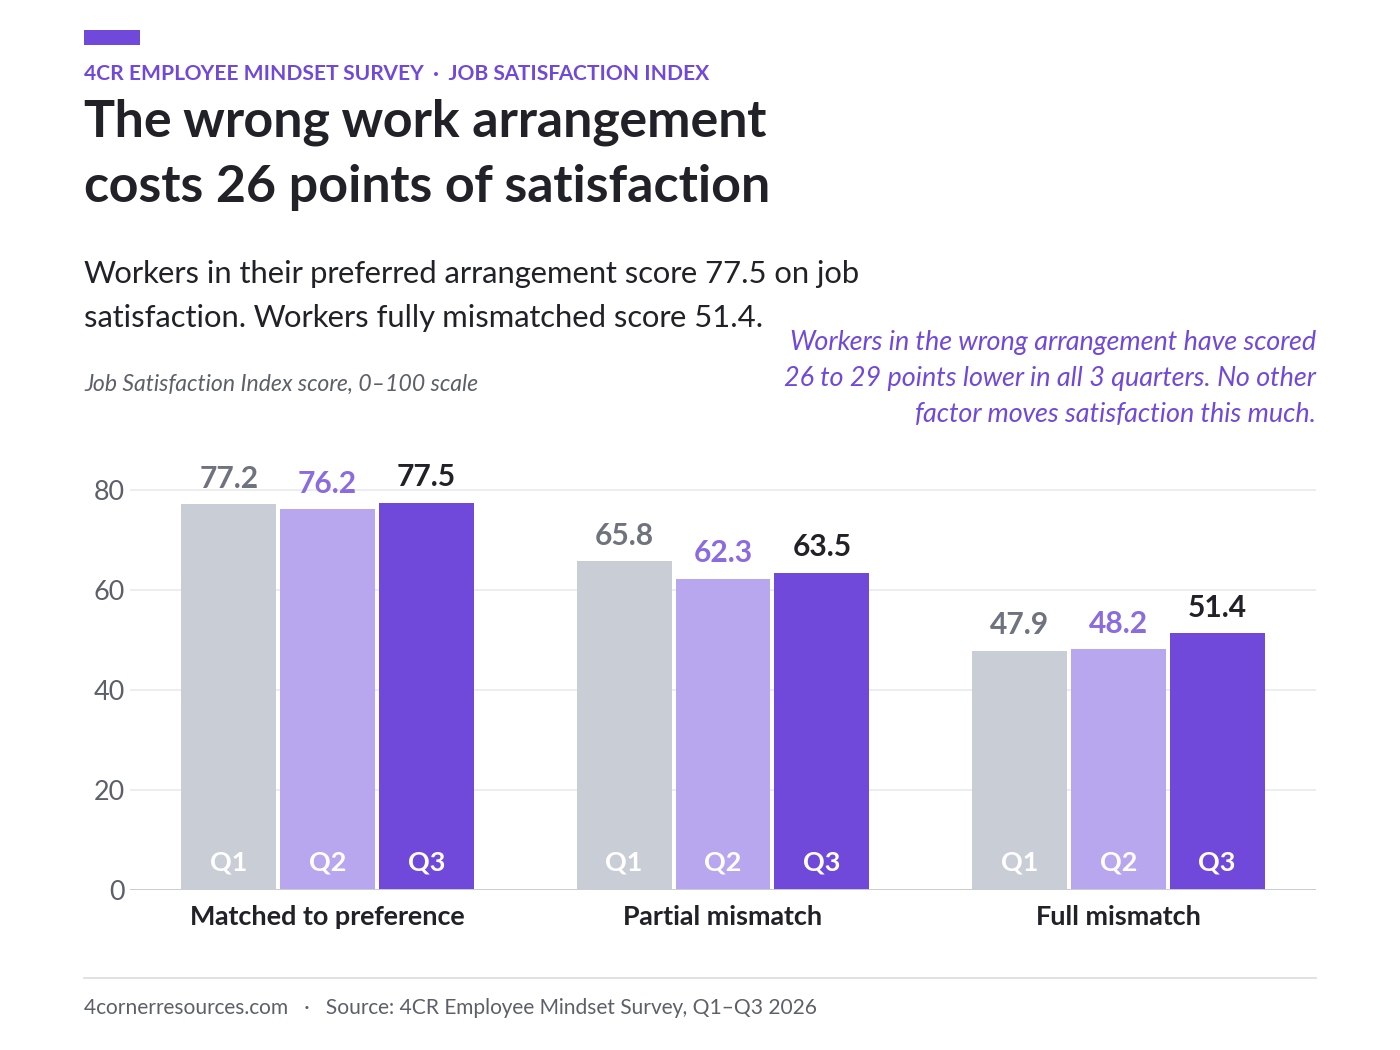
The wrong work arrangement costs 26 points of satisfaction
Workers in the arrangement they want score 77.5 on job satisfaction. Workers who aren’t score 51.4. That 26-point gap is the largest in the entire survey, it shows up at every job level, and it has appeared in all 3 quarters.
AI Threat
Career-level AI worry remains high
Overall AI threat has been stable for 9 months. But when workers are asked whether AI will hurt their own career, worry jumped in Q2 and has stayed high since. It is the only AI measure steadily declining so far this year.
Employee Confidence
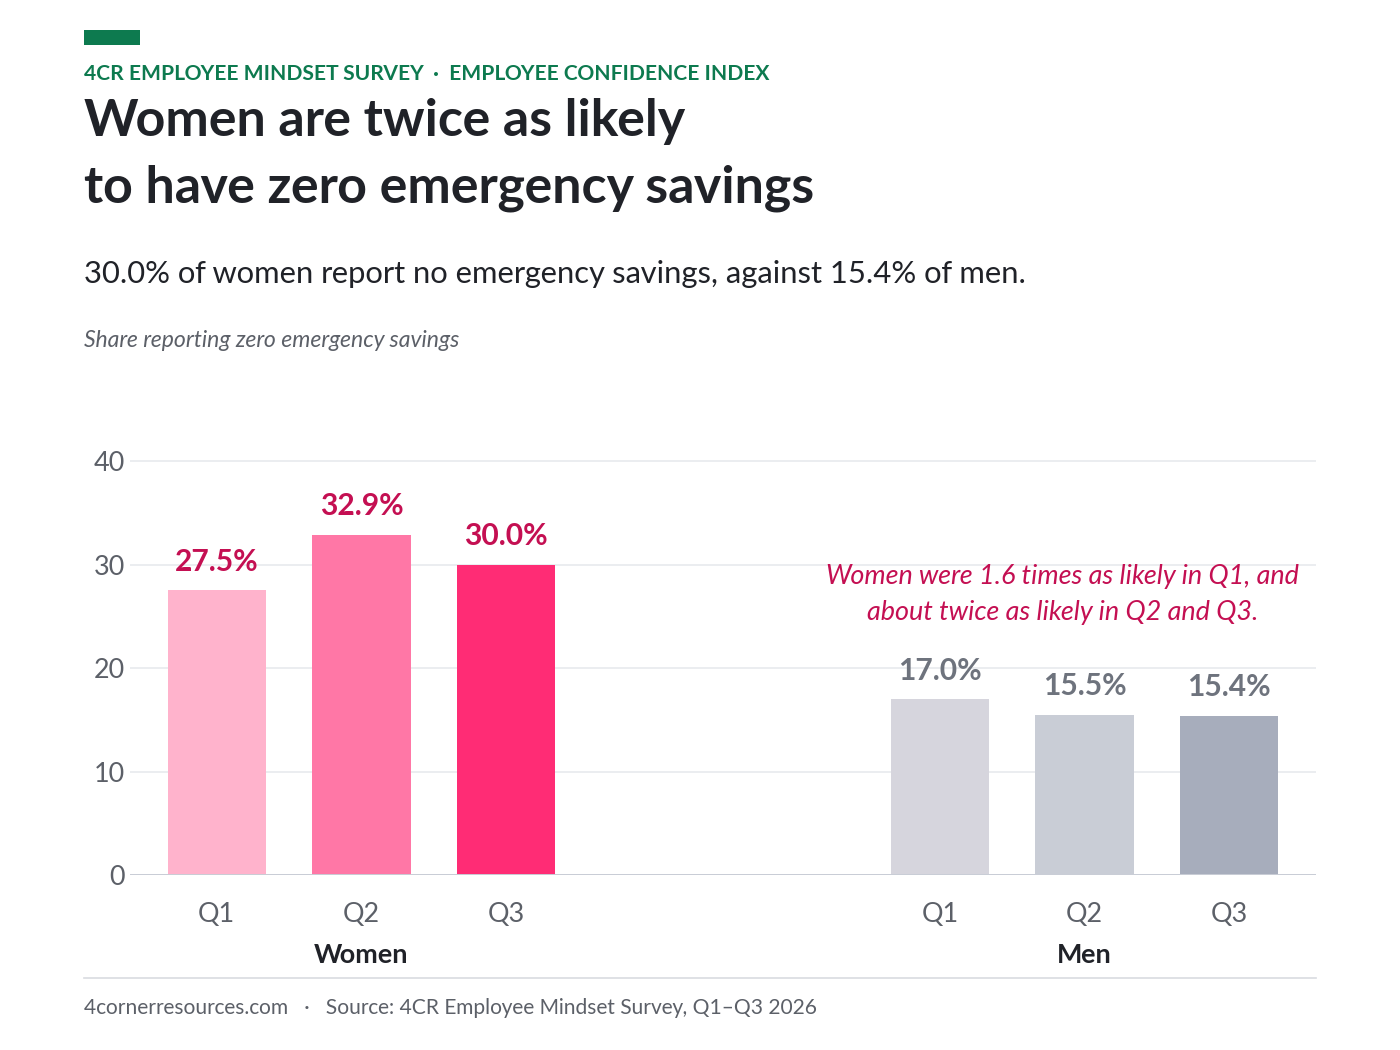
Women are twice as likely to have zero savings
30% of women have no emergency savings at all, compared with 15.4% of men. The gap has been close to 2 to 1 in every quarter this year.
Job Satisfaction Index
Measuring contentment with current employers, expected tenure, stress levels, work environment fit, and compensation adequacy.
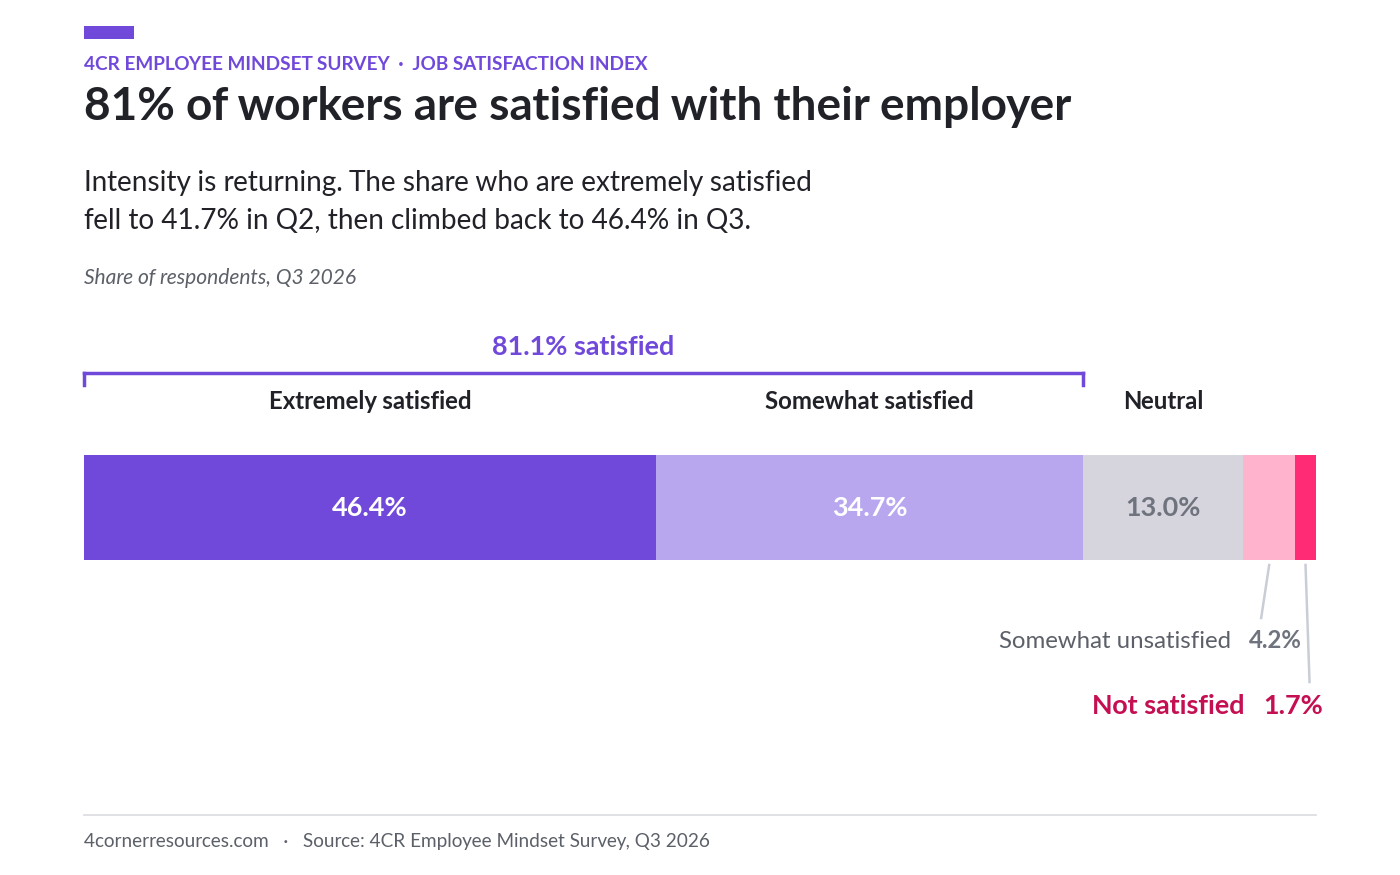
At 71.6, the JSI recovered just over half of its Q2 decline. 81% of workers are satisfied with their employer, and 46.4% call themselves extremely satisfied, up from 41.7% last quarter. Most of that recovery came from a single component.
Pay Perception Drove the Rebound
Of the 5 JSI components, only one recovered by a statistically significant amount in Q3: how workers feel their pay compares with the cost of living, which climbed from 59.2 to 63.5. Core satisfaction held steady at 79.9 after its Q2 drop. Workers feel better about what they earn, while their feelings about the job itself have stopped declining.
The Intensity Signal
The share of workers who are extremely satisfied rose from 41.7% to 46.4% this quarter, recovering more than half of its Q2 decline.
Work Arrangement Is the Biggest Satisfaction Factor
Workers in their preferred arrangement score 77.5 on job satisfaction. Workers in an arrangement they did not choose score 51.4. The gap has been 29.3, 28.0, and 26.1 points across the 3 quarters, and it appears at every job level: 18 points among managers and 28.6 points among entry-level workers. No other factor in the survey comes close.
Satisfaction Rises With Seniority
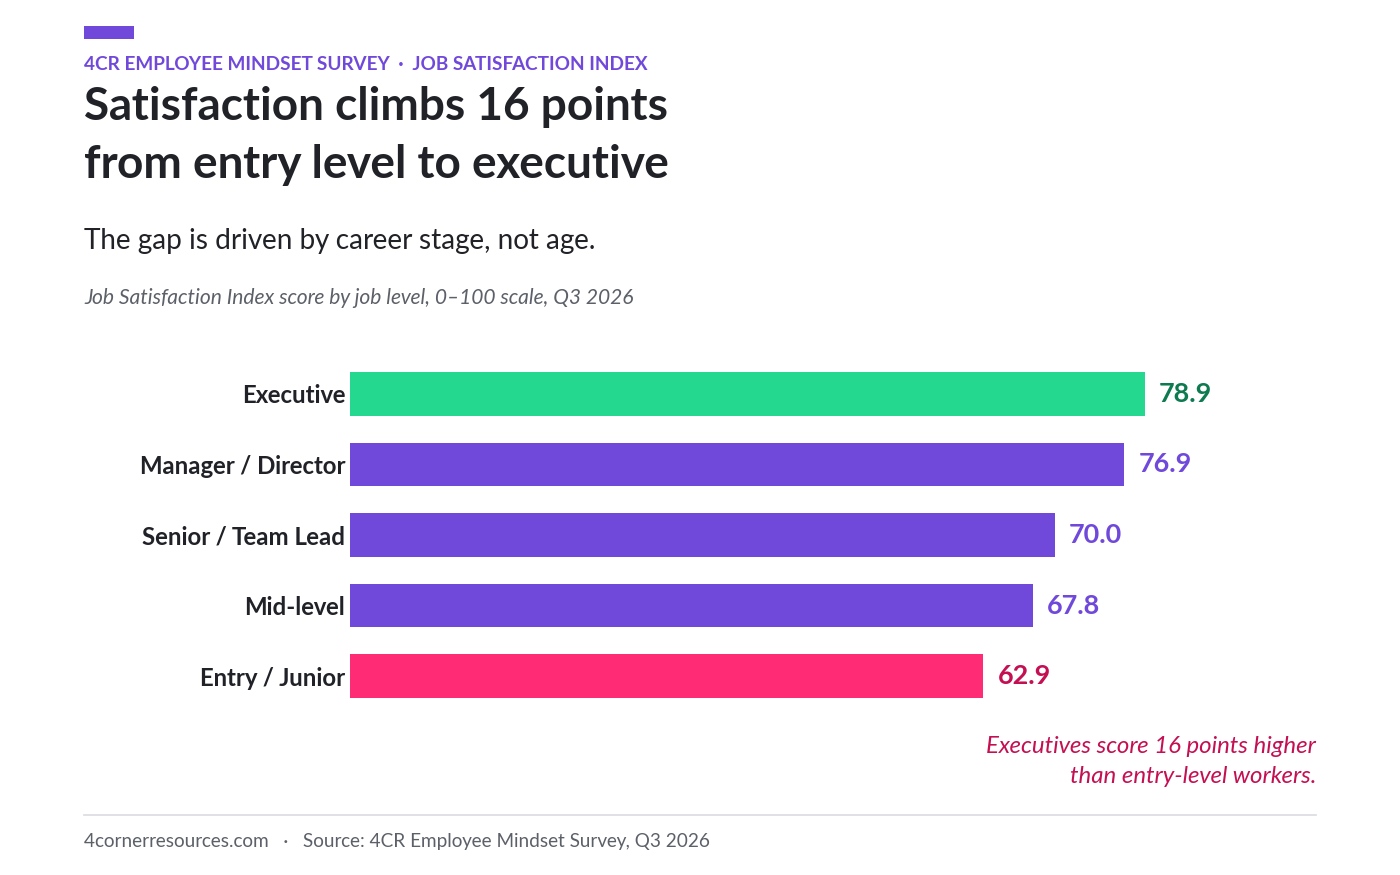
Executives score 78.9 on job satisfaction. Entry-level workers score 62.9. That 16-point spread is the widest demographic gap in the Q3 survey, and the seniority divide has appeared in every quarter. Career stage explains it better than age, because the gap appears even among workers of the same generation.
Rebounding on Pay
▲ 1.2 from Q2
Employee Confidence Index
Measuring role stability, job market anxiety, market outlook, trust in official data, and savings runway.
The ECI climbed 2.0 points to 63.0, the only index recovery this quarter that is statistically confirmed. One pattern sits behind every number in this section: trust in official job market data is the strongest single predictor of confidence in the survey. Workers who fully trust the data score 76.3. Workers who fully distrust it score 47.2.
Market Confidence Is Recovering
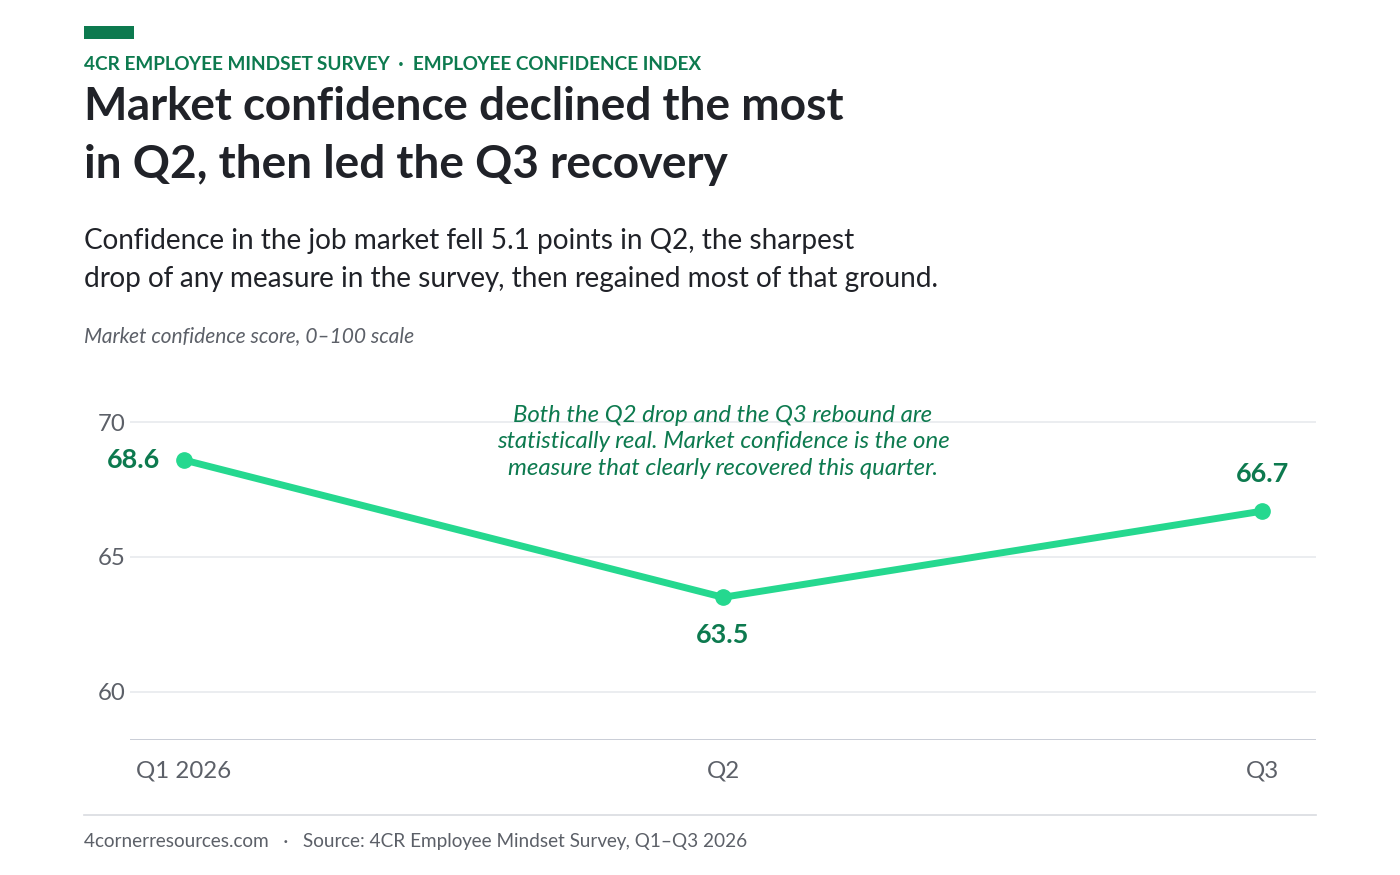
Market confidence posted the largest component drop of any index in Q2, falling from 68.6 to 63.5. In Q3 it climbed back to 66.7, the only ECI component with a statistically confirmed recovery. Workers’ outlook for the next 6 to 12 months fell first and recovered first.
The Recovery Signal
61% of workers now feel confident about the job market’s next 6 to 12 months. Both the Q2 drop and the Q3 recovery are statistically significant.
Many Workers Still Lack a Savings Cushion
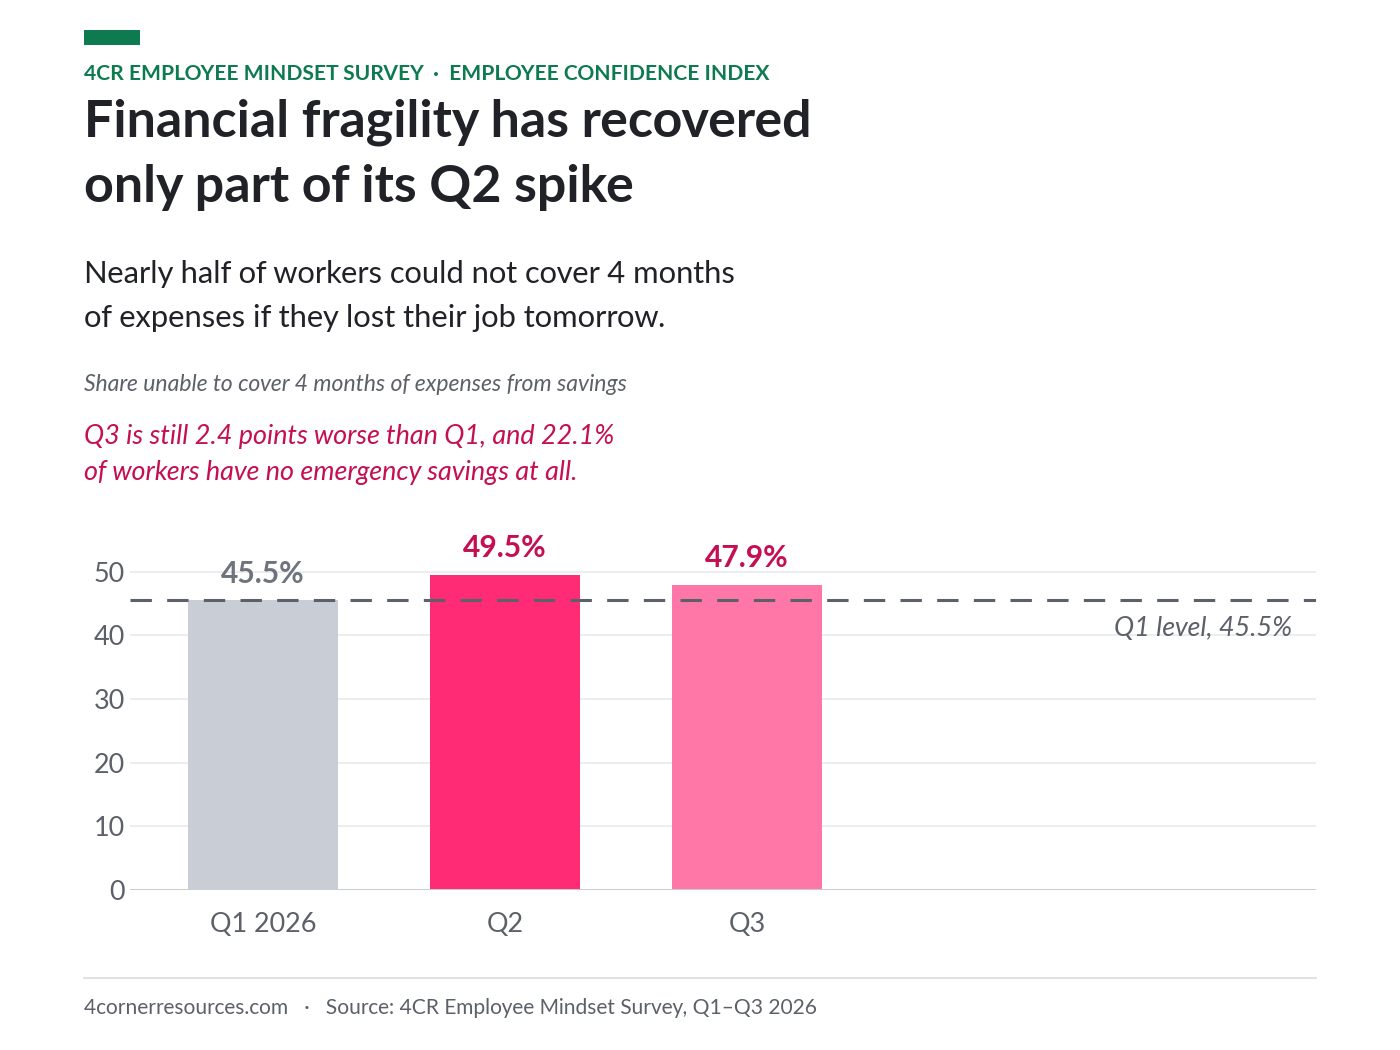
47.9% of workers could not cover 4 months of expenses without a paycheck. That is better than Q2’s 49.5% but still well above Q1’s 45.5%. Sentiment has returned to where it started the year. Household savings have not.
No Savings at All
22.1% of workers have no savings at all and would need a new job immediately if this one disappeared.
Women Are Twice as Likely to Have No Savings
30% of women report zero emergency savings, compared with 15.4% of men. Women have been 1.6 to 2.1 times as likely to have no savings across the 3 quarters, and roughly twice as likely since Q2. The gap also appears within the Millennial generation on its own, so age does not explain it.
The Confirmed Recovery
▲ 2.0 from Q2
AI Threat Index
Measuring AI threat perception, career impact expectations, concern timelines, and self-assessed replaceability.
The AI Threat Index has read 33.2, 32.9, and 32.6 across the 3 quarters. None of those moves is statistically significant, making it the most stable number the survey tracks. The movement that does exist sits below the surface, concentrated in specific workers and specific industries.
The Heaviest AI Users Feel the Most Threatened
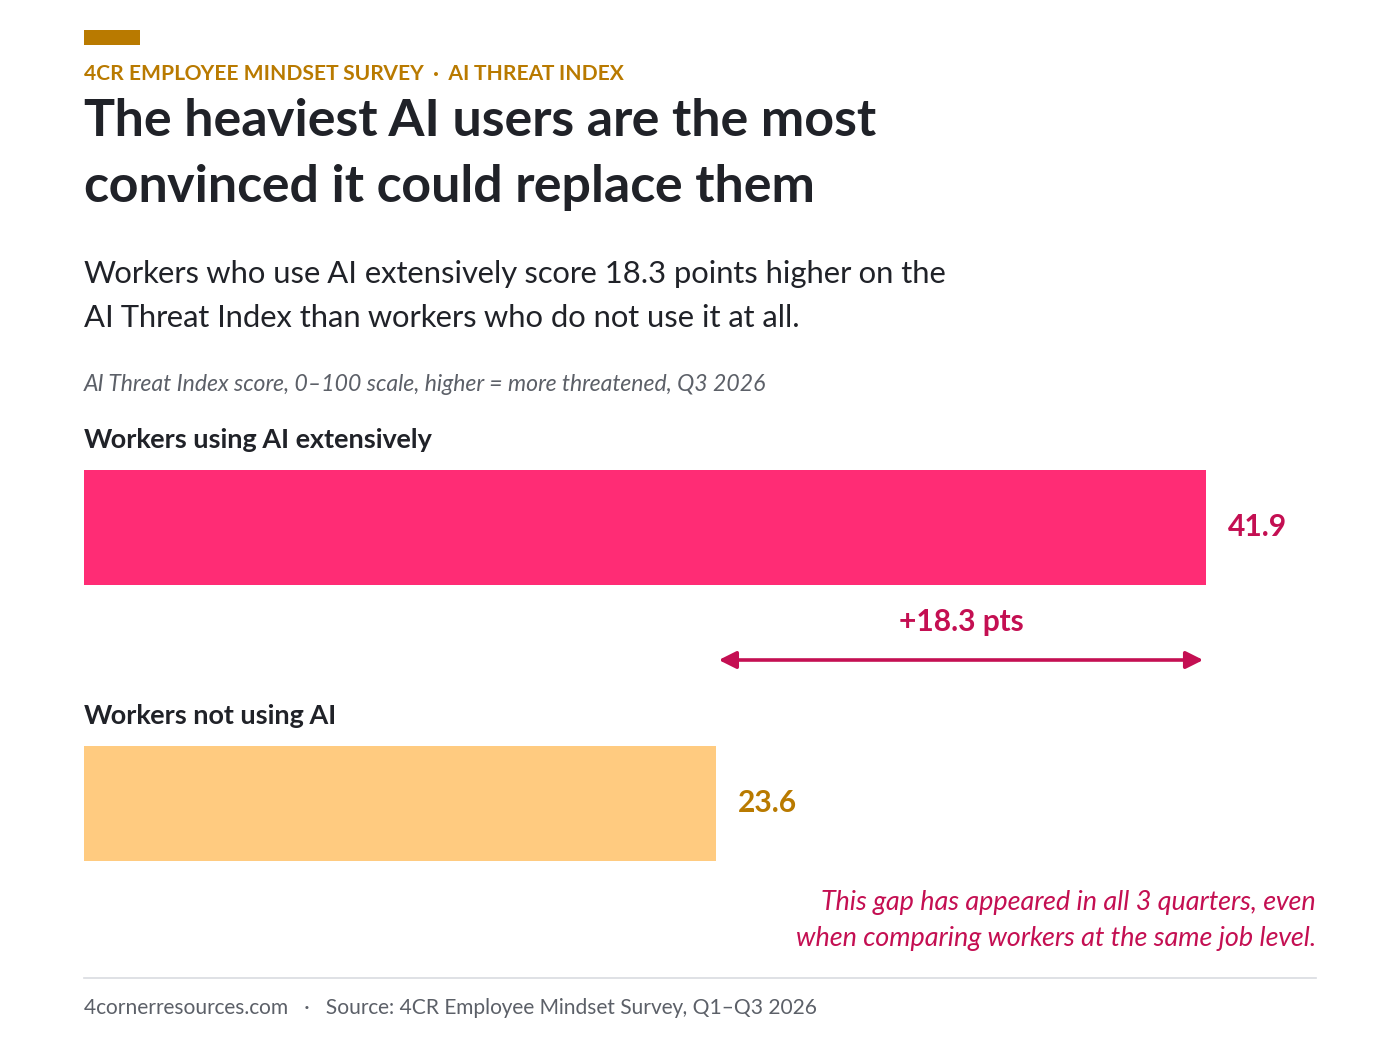
Workers who use AI extensively score 41.9 on the AI Threat Index, compared with 23.6 for workers who do not use it. That 17-to-18-point gap has appeared in every quarter, and it holds even when comparing workers at the same job level. The workers who know AI best are the most convinced it could replace them.
The Usage Paradox
70.6% of workers now use AI at work. The gap in threat perception between the heaviest users and non-users has never dropped below 16.5 points.
Fewer Workers Expect AI to Help Their Careers
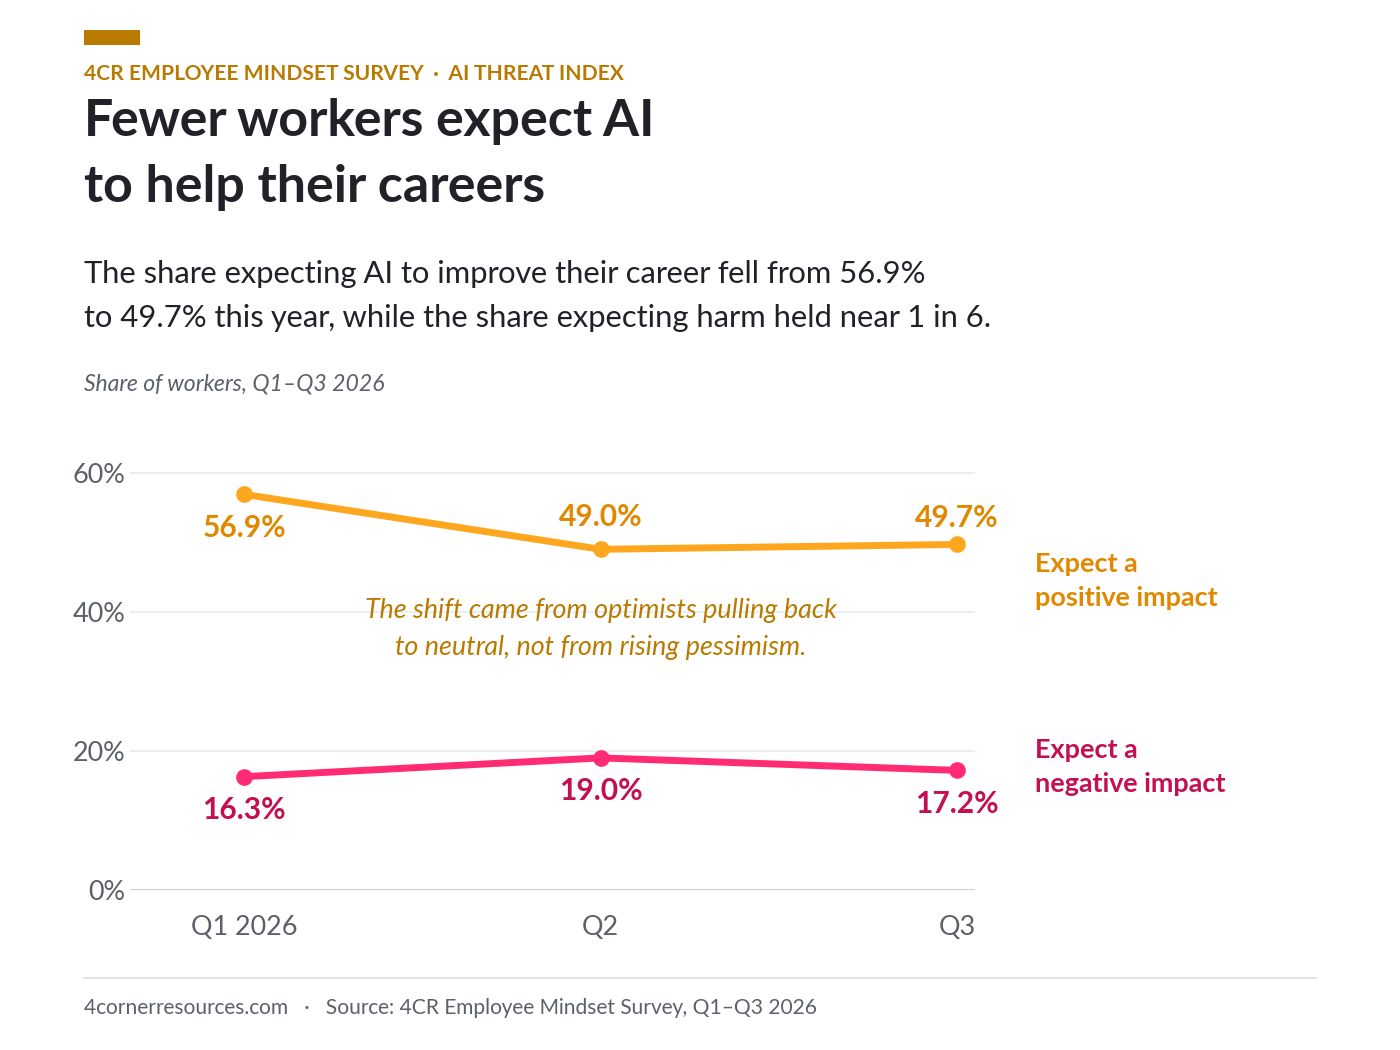
The survey asks what impact workers expect AI to have on their career in the next year. The share expecting a positive impact fell from 56.9% in Q1 to 49.7% in Q3, a statistically significant drop that has not recovered. 17.2% expect a negative impact, about 1 in 6, roughly unchanged all year. The shift came from optimists pulling back to neutral, not from rising pessimism. Every other sentiment measure that declined in Q2 has since bounced back. This one has not.
AI Concern Is Concentrated in Finance and Tech
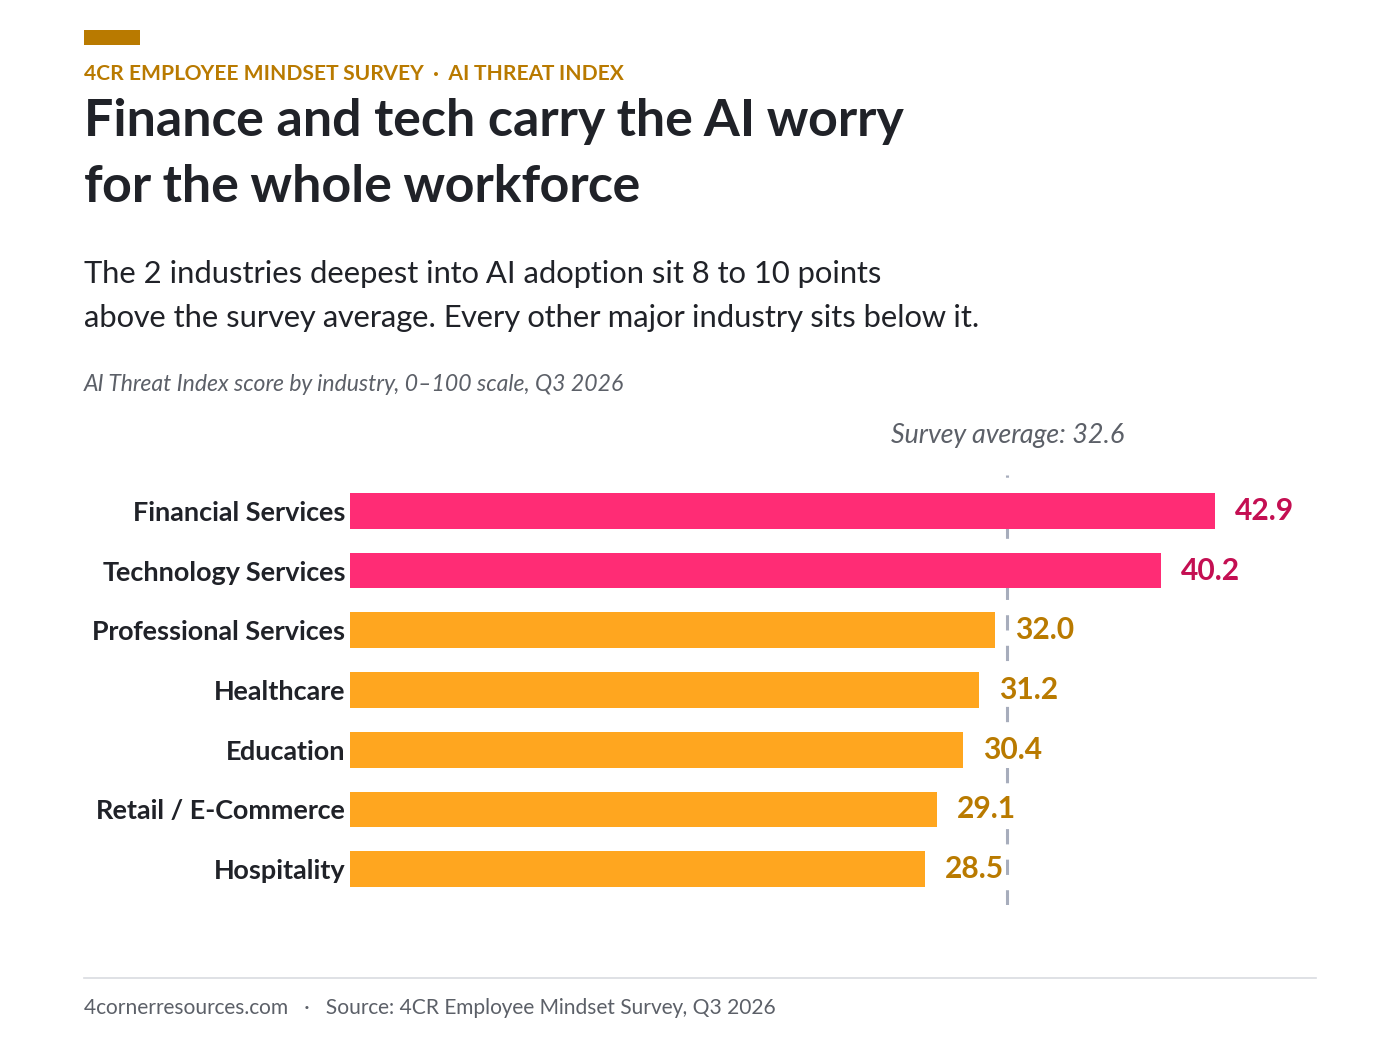
Financial Services (42.9) and Technology Services (40.2) post the highest AI threat scores of any industry with a reliable sample size, roughly 11 points above all other industries combined. These are the industries adopting AI fastest, and their workers feel it most.
The Calm Majority
24.1% of workers say nothing threatens their job at all. That is the most common single answer to the biggest-threat question, ahead of economic conditions and AI.
Flat Surface, Moving Floor
▼ 0.3 from Q2